


Table of Contents
- Why We Wrote This
- Who Should Read This
- What Does RFM Stand For?
- The Origins of RFM Analysis
- How to Calculate RFM Scores
- Deriving Customer Segments from RFM Scores
- Recency, Frequency, and Modern Machine Learning
- RFM Analysis in Excel or Google Sheets
Why we wrote this
This article will teach you how to use Recency, Frequency, and Monetary (RFM) analysis to score and rank individual customers or customer groups in your database.
RFM Analysis enables data-driven eCommerce marketers to predict the behavior of new customers, deliver more relevant marketing campaigns, enhance their customer segmentation strategies, drive customer loyalty and trigger marketing programs when important RFM score changes occur. This customer segmentation technique will, in turn, create marketing programs with higher response rates and conversion rates.
The thing that we love most about RFM is that you don’t need fancy, expensive analytics tools to get started. Simply export your customer file as a .csv and you’re ready to dive in.
Who should read this
This guide is written for data-driven eCommerce marketers, data mining enthusiasts, database marketing students, and retail Founders seeking to deliver more profitable and relevant direct marketing programs to their customer base. RFM Analysis inherently eliminates marketing waste by providing a framework to avoid allocation of marketing before it’s actually necessary.
Imagine a world where you are only delivering email and direct mail campaigns to those customers who have signaled, based on their behavior, that they need to be marketed to. This is the reality that RFM segmentation creates.
What does RFM stand for?
[R] Recency – Recency score is calculated based on a customer’s last purchase date. For eCommerce companies, this is typically measured as days since last customer purchase. Customers who have purchased more recently are more likely to purchase again when compared to customers who have purchased less recently.
[F] Frequency – Frequency score is calculated based on the sum of purchases throughout a customer’s lifetime. Customers who purchase more frequently are more likely to purchase again when compared to customers who have purchased only once, or less frequently.
[M] Monetary – The sum of revenue a customer spends in their lifetime. Customers who have higher total monetary spend are more likely to purchase again in the future when compared to customers who have spent less monetarily.
The origins of RFM analysis
RFM segmentation was first employed by direct marketers sending catalogs via direct mail in the 1930s and 1940s. Catalogers would maintain and update a 3×5 index card for every customer in their file. Each index card was then forced ranked by when the customer made their last purchase, how often they purchased, and how much the customer had spent in their lifetime.
They had proven time and time again that customers with high RFM were the customers most likely to respond to new catalog deliveries. Their main objective for “ranking” customers in this fashion was to avoid sending costly print catalogs to customers who were unlikely to convert.
For today’s marketer, the cost of sending email is negligible compared the cost of producing print catalogs in the 1930s. In 2018, wasteful marketing has other costs like customer annoyance, opt-outs, negative brand equity, and worse of all, customer apathy.
How to calculate RFM scores
In order to start the scoring process, export line item transactions by customer email address or customer ID from your eCommerce platform. From here on out, we assume that you’re scoring an eCommerce customer database and that we’re using purchase as the primary behavior being measured for recency and frequency. You’ll need to do some aggregation in order to assemble a customer dataset that is scorable, so let’s dive into the data:
- QA Your Raw Dataset. Remove fraudulent orders, outliers, and non-customers from your source data.
- Assign Each Customer a Unique ID: Your dataset should key off a unique customer email address or other identifiers that can be used to aggregate purchase data under a single record per customer.
- Determine Most Recent Purchase Date (R): For each customer, determine the date of their most recent purchase and add it to a column labeled, “Last Purchase Date”
- Sum Purchase Count (F): For customers that have purchased more than once, we’ll want to sum those purchase events so that we can rank the customer’s total number of purchases over time, relative to the purchase counts of other customers in the database. Put the total in a column labeled, “Purchase Count”.
- Sum Total Spend (M): Combine the monetary value of each order per customer into a column labeled, “Total Spend”.
Now, we’ll want to add three new columns next to the ones we just created labeled, “R”, “F” and “M”. You’ll end up with a sheet that looks something like this:
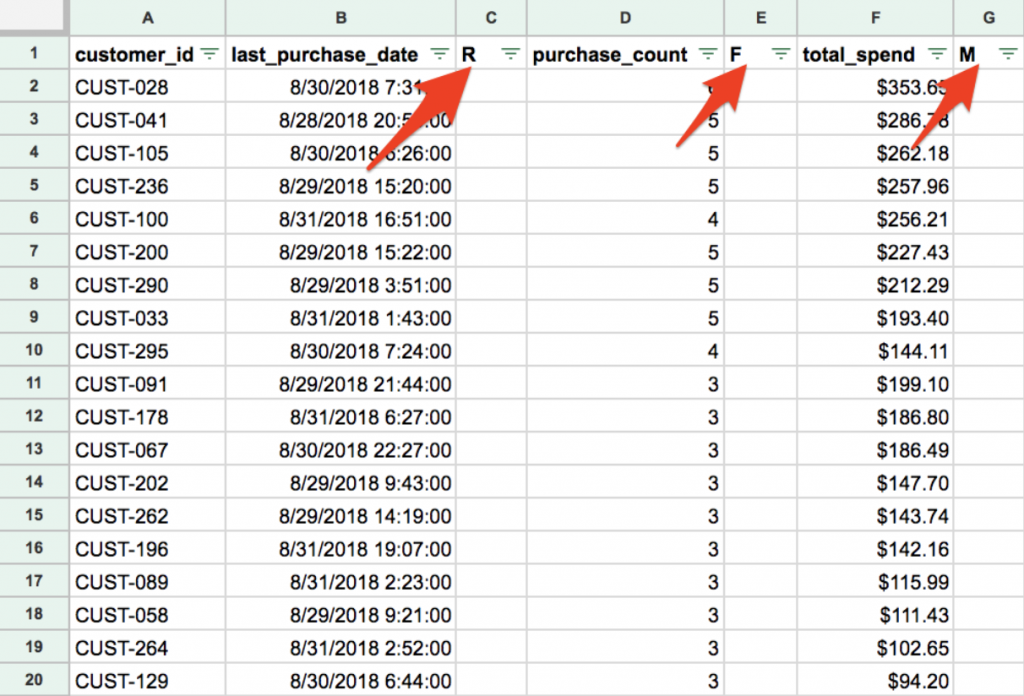
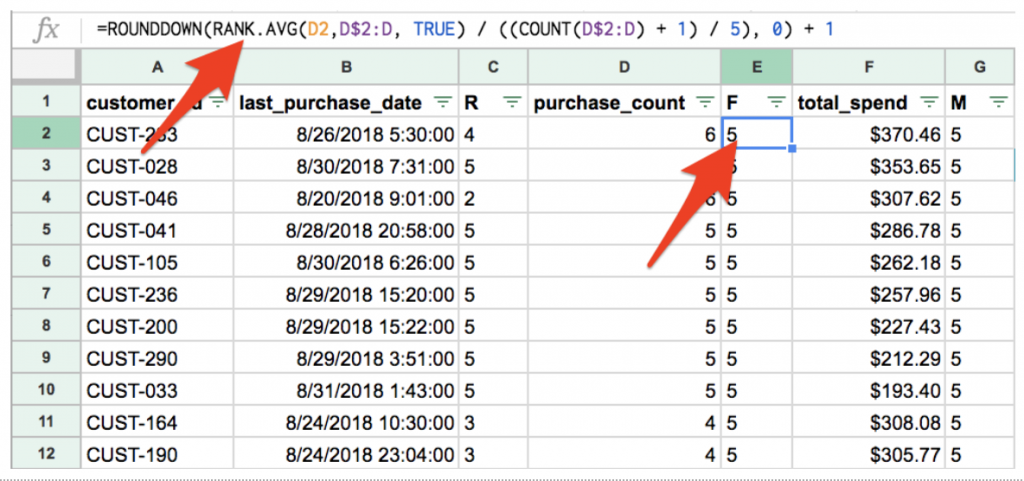
Now, the magic happens. Let’s start scoring. We’re going to sort each dimension of RFM, ascending, and assign a score based on where each individual customer falls relative to other customers in the database. We’re simply sorting the columns for R, F, and M and assigning a numeric rank to them. For each dimension, we’re going to break up the database into quintiles (Top 20%, Second 20%, etc) and assign a score of 1-5 to each customer dependent on which quintile they fall into. Like this:
Once we’ve gone through this forced ranking exercise for each dimension of RFM, we’ll concatenate the score into a column labeled, “RFM Score”.
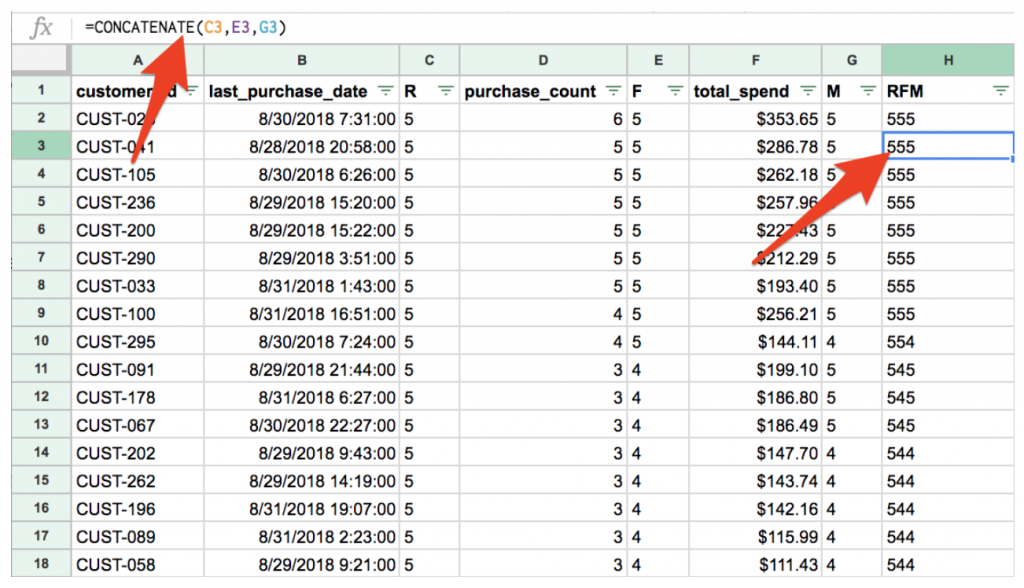
The customer with a rank of 555 is your most recent, most frequent, and biggest monetary spender. A customer with a rank of 111 is the opposite (and probably not worth marketing to). A customer with a rising score is becoming a more valuable customer. A customer with a falling score is likely disengaging from your brand. The key here is to be able to recognize when these changes occur and react to them.
Performing a static analysis like this in a spreadsheet has some shortcomings.
Customer behavior changes by the minute. Customer databases are living, breathing entities that evolve as customers transact with an eCommerce business.
The second the spreadsheet-based RFM analysis is complete, it’s out of date when the next order occurs. Static analysis also limits marketers ability to trigger marketing when RFM scores change. This capability becomes transformative when an automated system is established to keep RFM scores up to date, which in turn creates the ability to react and trigger marketing based on RFM change. Rejoiner specializes not only in calculating RFM scores for eCommerce customer bases but can also trigger automated email workflows when important changes occur.
Here’s an example: A high-value customer consistently scores in the top quintiles for R, F and M. Your RFM score monitor sounds the alarm when that high-value customer dips below a certain threshold of engagement, which signals that the customer may be defecting. Time for marketing! We’re not wasting our efforts blanketing the entire customer base with the same email blast. Instead, we’re waiting for RFM to tell us when an individual customer needs our attention.
This, my friends, is the foundation of data-driven, profitable, eCommerce email marketing.
Deriving customer segments from RFM scores
There is no better predictor of future purchase behavior and future customer lifetime value than historical purchase behavior. It is the single most important behavior that we have at our disposal to model our customer segments around.
Once these segments are defined, it enables us to monitor how customers are moving from segment to segment and which customers need attention. We can also:
- Trigger automated emails when possible customer value changes
- Design more effective loyalty program to sure that our best customers stay our best customers
- Do everything in our power to maximize the value derived from defecting customers, reducing churn rate
- Predict who our best customers will be in the future based on what we know about our best customers today.
Rejoiner dynamically generates customer RFM segments based on the recency and frequency of two dimensions: 1) Purchase behavior and 2) Email engagement data. The combination of these two behavioral datasets allows to model different customer segments into the following cohorts:
SEGMENT DESCRIPTION
New Subscribers: These are identifiable customers who very recently joined your email marketing list, but haven’t purchased yet.
Window Shoppers: These are identifiable customers who have never purchased but are spending time browsing product detail pages.
Hot Prospects: These are potential customers with the highest levels of purchase intent. They are adding to cart, potentially abandoning transactions, and appear to be ready to buy.
Champions: There are your most loyal customers. They are your big spenders, purchase the most frequently, and have very high recency.
Regulars: These are great customers who purchase regularly and frequently. They are on their way to becoming Champions.
Potential Regulars: These are customers who have purchased recently, more than once, and are on their way to becoming better customers.
New Customers: These are new customers who have purchased recently, but only once.
Promising: These are also new customers who have purchased recently but spent a little bit more or more than once in a short period of time.
Cooling Down: These customers were once Regulars or Champions, but have decelerated their purchasing activity. This group needs attention.
At Risk: These are customers with above average recency, frequency, and monetary characteristics but are well past the point of abnormal purchase recency. You don’t have much time left to re-engage these folks.
Highly at Risk: These are formerly high-value customers who are in the final stage of defection. If we don’t market to them now, it’s likely that we’ll lose these customers forever.
Lost/Ignore: These are customers with low frequency, low recency and low monetary scores. Don’t invest marketing resources or attention here.
Recency, frequency, and modern machine learning
RFM was obviously developed by marketers long before the advent of today’s machine learning, artificial intelligence, and data science methodologies. RFM is a simple tool in comparison. RFM’s simplicity is both its primary strength and its biggest weakness. It’s a strength in that one could very quickly and cost-effectively start using RFM to deliver more relevant, timely marketing that is far more profitable than typical batch and blast strategies. Its simplicity is also a strength in that it can be understood by non-technical internal stakeholders as to why certain marketing decisions are being made.
However, the very construction of RFM is its biggest weakness. The model only accounts for 3 variables. More advanced predictive modeling can employ hundreds or evens thousands of other variables in search of recognizable patterns. It would be cumbersome to include variables like product affinity, satisfaction indicators, referral sources, promotion usage, or demographic variables in our spreadsheet.
For more advanced applications that explore the relationships between variables other than purchases, predictive modeling may be a more effective, albeit much more expensive, way to surface insights about your customers.
RFM analysis in Excel or Google Sheets
To get you started with your own RFM modeling exercise, we’ve prepared a templated Google Sheet for you to copy and explore.
What to do next
- Experiment with your own RFM models using the formulas in this Google Sheet. You’ll need to create a copy for yourself to make changes.
- Schedule a free strategy session if you’re interested in more sophisticated ways of leveraging your customer data to deliver more profitable marketing.

